MatPlotlib解决中文和负号问题
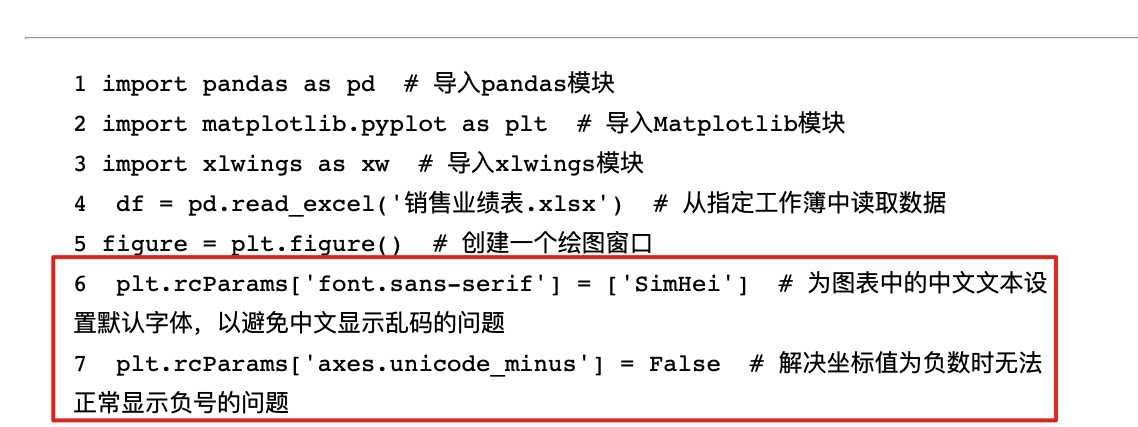
import matplotlib.pyplot as plt
import pandas as pd
import xlwings as xw

df = pd.read_excel('销售业绩表.xlsx')
figure = plt.figure()
plt.rcParams['font.sans-serif'] = ['SimHei']
plt.rcParams['axes.unicode_minus'] = False
Pandas设置行列不忽略、展示行数列数
pd.set_option('display.max_rows', 100000)
pd.set_option('display.max_columns', 1000)
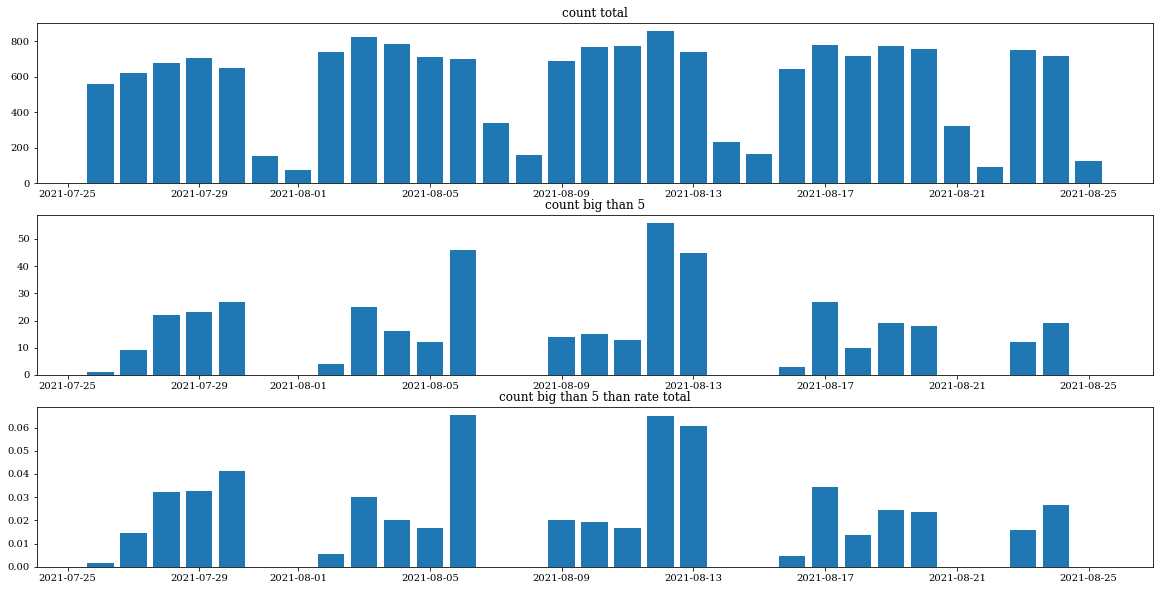
matplotlib多个子图
plt.subplot(3, 1, 1)
plt.bar(line_all["bigger"].index, line_all["total"])
plt.title(f'count total')

plt.subplot(3, 1, 2)
plt.bar(line_all["bigger"].index, line_all["bigger"])
plt.title(f'count big than {min_second_count}')

plt.subplot(3, 1, 3)
plt.bar(line_rate.index, line_rate.values)
plt.title(f'count big than {min_second_count} than rate total')

plt.show()